File:Iothrottled graph.png
From docs.betterlinux.com
No higher resolution available.
Iothrottled_graph.png (679 × 232 pixels, file size: 25 KB, MIME type: image/png)
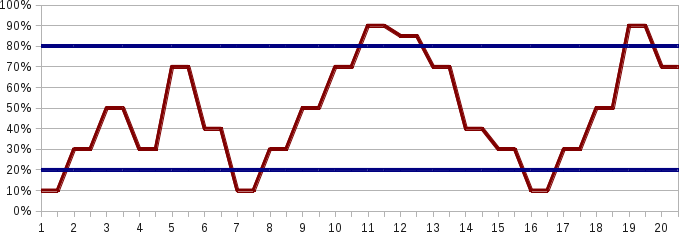
If one were to graph the utilization over time, the goal is to have that graph look something like this:
File history
Click on a date/time to view the file as it appeared at that time.
| Date/Time | Thumbnail | Dimensions | User | Comment | |
|---|---|---|---|---|---|
| current | 01:42, 14 January 2012 | 679 × 232 (25 KB) | James (Talk | contribs) | If one were to graph the utilization over time, the goal is to have that graph look something like this: |
- You cannot overwrite this file.
File usage
The following page links to this file: